Radiometric Thermal Analysis
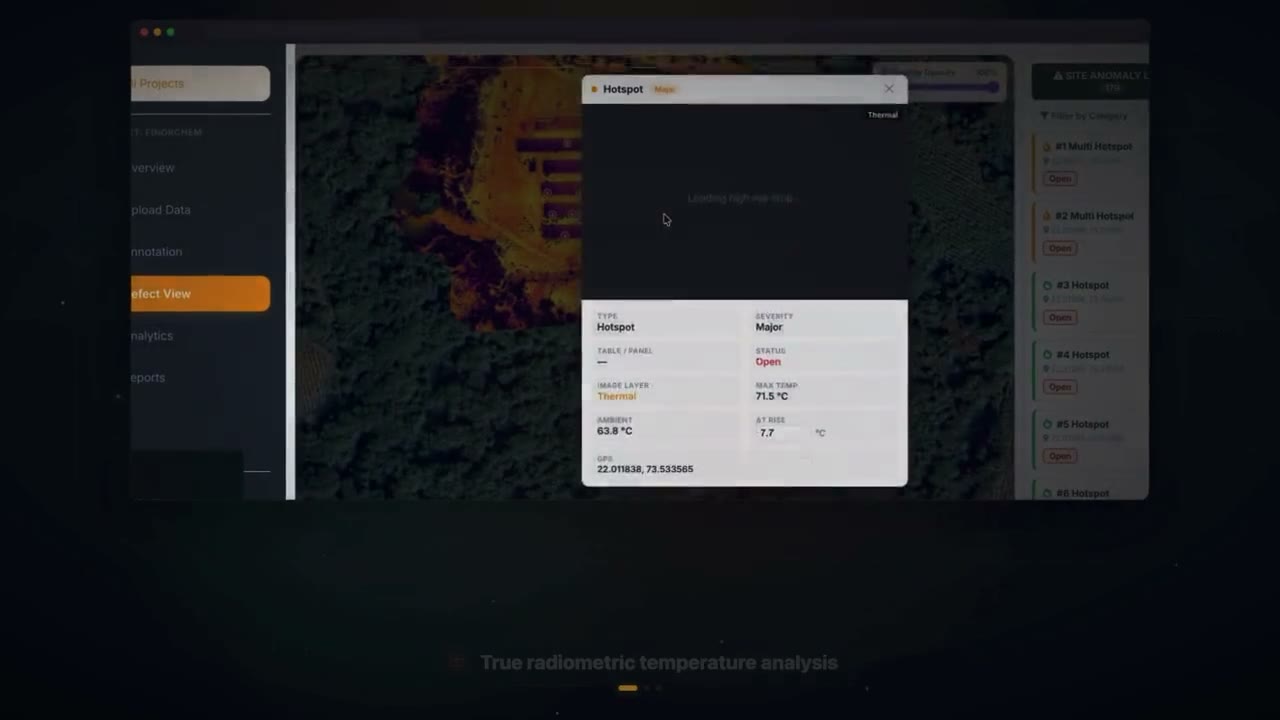
True per-pixel temperature extraction from radiometric imagery. Automatic ΔT calculation against local ambient, with severity graded to IEC thresholds — not colour-map guesswork.
AI Defect Detection
Trained detection models scan every panel across the orthomosaic and flag anomalies automatically, so analysts review findings instead of hunting for them frame by frame.
Orthomosaic Annotation
Pan and zoom a full-plant thermal or RGB orthomosaic in the browser. Draw, edit, and reclassify defects on a tiled map with synced dual-layer split view.
GPS-Tagged Defect Map
Every defect carries real-world coordinates plus table, row, and module numbering — so a field technician walks straight to the faulty module instead of searching the array.
IEC 62446-3 Reports
One-click PDF reports with thermal crops, temperature data, severity breakdown, and site summaries — formatted to the standard your O&M contract is audited against.
Analytics & Revenue at Risk
Severity and defect-type breakdowns, resolution tracking, and a state-wise tariff estimate of the generation revenue your open defects are costing you.
Role-Based Team Access
Admins, analysts, clients, field pilots, and technicians each get a scoped view. Client organisations see only their own plants, with per-project assignment for field crews.
Field Technician Mobile View
A dedicated mobile dashboard for crews on site: open defects by priority, navigate to coordinates, and close out repairs with photo evidence from the array.
Secure Multi-Tenant Cloud
Organisation-level data isolation, encrypted storage, audit logging, and optional MFA. Your inspection data stays yours and stays separated from every other tenant.